Climate control is typically based on measurements of what is occurring, and what has occurred and then responding accordingly. However, nowadays, growers are increasingly searching for insight into likely future scenarios so they may respond with foresight instead. Data analysis could offer a valuable contribution to their efforts.
One company that is both actively and highly involved in practical data applications is LetsGrow.com. Many growers are familiar with their comparison platform for climate and other company registration data. Undeniably, this offering has played a major role in its success. However, as time progressed, LetsGrow.com has shifted its emphasis towards Data Driven Growing solutions.
Growers have become highly capable of figuring out why their crop visibly reacted in certain ways, and in responding suitably. With large amounts of data now being captured, both crop consultants and growers have turned to ask themselves if they could also predictively calculate their crop’s reactions.
How will current greenhouse configurations, combined with expected outside climate conditions, affect the plant with regards to e.g., production, odds of fungal diseases energy management, or the influence of temperature differences inside the greenhouse? How could I further align climate settings and irrigation to the crop’s development and plant’s needs?
Growers prefer checking upfront which option offers optimal results, and what configurations are required to reach the desired outcome. Common Excel programs, when attempting to process the enormous amounts of available data, appear to fall short of truly uncovering what is within the realm of possibility.
Crop models
Great, explanatory plant physiological crop models are a basic necessity where data-driven and predictive growing is concerned. This allows LetsGrow.com to take advantage of the building blocks of its conception: providing growers with plant models developed by the WUR. It is a conscious decision to teach plant physiologists data skills rather than letting data specialists tackle horticultural applications.
Peter Hendriks, explains why this decision was made: “Although it is possible to pile all available data together and to start drawing conclusions from it, you would be at risk of making massive mistakes. The required knowledge of horticulture and plant physiology is not something that is easily acquired. Before you are able to effectively grow in a data-driven way, you have to understand both the processes taking place inside the greenhouse and the plant physiology at play, really well.” Although, there are, of course, mathematicians and specialized data scientists at work in the background to effectively process the data.
Valuable data
The amount of available data equals the amount of data available for analysis. Hendriks: “So I urge you not to rush into thinking ‘this data doesn’t serve me right now’. Save everything. You should see the amazing analyses we are able to perform based on company registration data that had been captured for five years or longer. Data that growers never used before, because they had little understanding of its potential yet.
Data sophistication greatly contributes to the reliability of analyses. So it is worth considering increasing your setting and coarseness counting frequency if, for example, you are only doing so once a week for a general indication.
There is so much more to be registered and calculated, but the outcome largely depends on the accuracy of the available data. Only accurate data can be effectively analyzed and delivers reliable conclusions. “So please do not calibrate your sensors and measuring equipment solely for the purpose of direct climate regulation. Incorrect calibration also results in the loss of valuable data for later analysis. If you are not careful, you will always, regardless of what you do, continue to bring those mistakes in your data with you.”
Instead of blindly trusting computer-generated advice based on data analyses, it is good to realize that all changes in data tell us a story. “When something truly out of the ordinary happens, there is typically a very logical reason behind it. With data analysis, it is crucial to find that reason first or you are at risk of drawing incorrect conclusions from that data. Simply put: could an external occurrence offer a valid explanation, e.g., storm damage or a disease outbreak?”
Balance
Data analyses are a welcome addition to human cultivation knowledge. Every grower has his ‘green thumbs’ and his own interpretation of cultivation data, which he applies to regulate the greenhouse climate. However, especially large-scale companies, as well as growers working together within an association, are regularly confronted with differences in yield or crop position between cultivation sites, which are beyond explanation based on an exchange of opinions alone.
LetsGrow.com ascertains that production differences among cultivation sites can be explained with data analyses, even down to the level of screen usage, window positioning, or use of other cultivation equipment. You can trace back why these things happen.
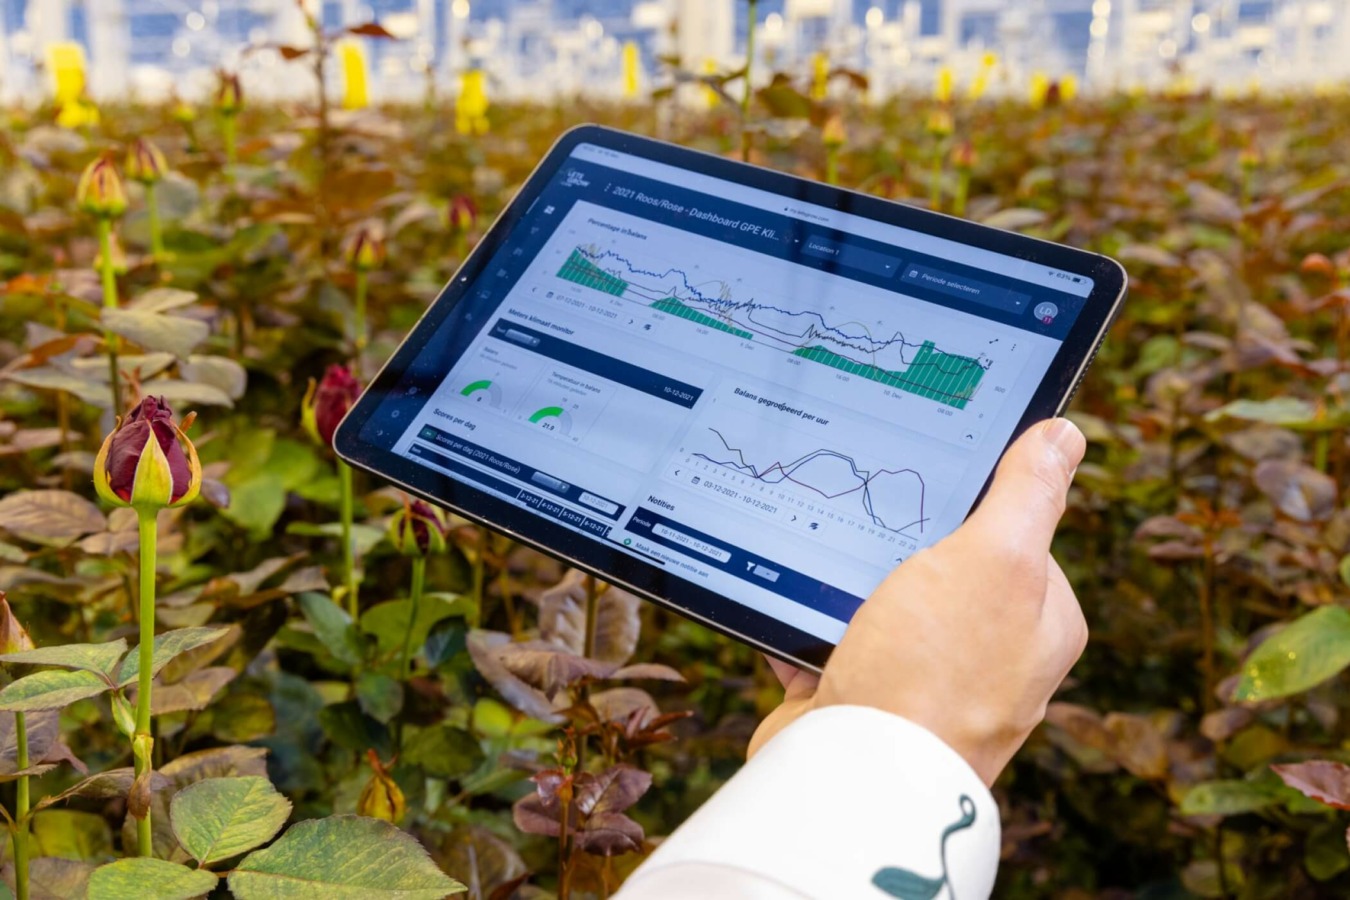
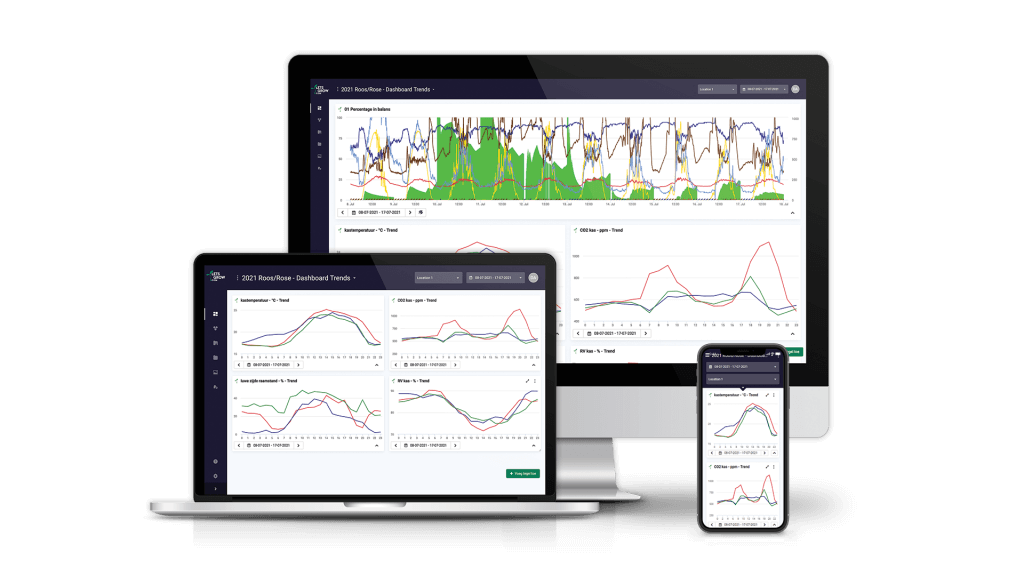
An analysis that proved highly useful is optimizing the light-temperature ratio, using the grower’s own climate data. Plotting each day’s average 24-hour temperature and the light sum has created a great foundation for gaining insight into the plant balance. The model that was developed for crops’ light use efficiency (LUE, in grams of production per megajoule of radiation sum) tries to find the ideal combination of (and balance between) light, humidity, temperature, and CO2. It also takes into consideration that the amount of light in, for example, week 21 does not correlate with the production in week 21, but has a delayed effect on production.
The often occurring wide spread of LUE at companies shows that there is potential for improved use of light. By identifying and eliminating the limiting factor with the greatest negative effect on light use efficiency, many growers have reached production increases of up to several percent. And sometimes there is no limiting factor present, and it could turn out that higher light availability offers the potential for an even higher plant load and production.
LetsGrow.com translates conclusions from data analyses to actions the growers can take. Hendriks: “Only, we do not take those actions for them. We simply inform the grower whether he is still following the ‘ideal’ line, and what he could have done. It is not our intention to replace the grower, but rather to ensure that he is empowered to improve his decision-making, or to enable him to manage a larger greenhouse area.” Although, besides decision-making support, there are growing aspects ready for automation right now. “Being required to change climate settings several times a day on the climate computer should not be a thing in today’s world.”
Sensors
Sensors that are capable of detecting changes invisible to the human eye, right now or at a later stage, support improved cultivation-related decision-making. There is a substantial increase in sensors hitting the market, including juice flow meters, fruit temperature meters, radiation meters, thermal imaging cameras, and mobile fruit counting robots.
Especially wireless sensors – which provide multiple measuring points in the greenhouse – contribute to added insight. One grower was able to use data analysis to explain why the façade side of the greenhouse consistently yielded more than the same crop row located closer to the middle path. Eventually, he even went as far as adjusting the architectural structure of his greenhouse, because this offered him an optimal balance befitting of his company-specific situation.
Hendriks: “The technology is coming to you. There are so many additional sensors coming towards you, and along with the added data they capture, it becomes impossible to maintain a bird’s eye view. Our vision is to create value from all of this data. With a shift from the familiar approach of measuring and reacting to having the foresight and acting pre-emptively instead. To maintain a sustainable line that keeps your crop in balance, rather than thinking: ‘Oh no, something’s wrong!’ and being forced to suddenly correct instead. The question ‘what should I do next’ then finally derives from a pre-emptive ‘I see something happening in my data’ rather than a late response to ‘I see something happening to my crop’.”
Artificial Intelligence
Whenever data analysis is involved, growers will often hear buzzwords such as Artificial Intelligence (AI) and self-learning data systems (Machine Learning). Although they realize that computers are capable of creating many analyses on their own, and their outcomes have become increasingly accurate with time, still, it is often unclear what these technological terms really mean.
Hendriks tries to explain: “Traditional models are programmed based on research outcomes spanning multiple years and registrations in a computer program. For example: if my greenhouse temperature increases by a degree, what would happen with the maturation rate? This allows the program to calculate the consequences, enabling predictions of current or expected cultivation circumstances.”
“Machine Learning, which is part of the broader Artificial Intelligence domain, requires entering results (such as kilogram yields or crop responses) from the past into a computer, combined with the climate data from the same period. The computer analyses and determines its own interrelationships, and takes these to create its own predictive program. It’s a much faster and very accurate way of predicting the effects of new actions taken.”
Source: Groenten & Fruit | Author: Peter Visser
Stay informed
"*" indicates required fields